Showing posts with label Guides/tips. Show all posts

Saturday, April 4, 2020

5 ways map can help communities respond to Covid- 19

Though the coronavirus disease outbreak is impacting global and national populations, there are steps to take at a local level to slow the spread. The coming days and weeks will demand a coordinated effort from federal agencies, state and local governments and private companies. 
Before widescale testing becomes available, states and cities can undertake effective measures to assess the situation, identify gaps and target interventions where they are needed most. 
Here are five proactive steps communities and health organizations can take to begin to understand and mitigate the impact of COVID-19 on public health:

1. Map the cases

The first step in combating the spread of any infection is getting a holistic picture of what is happening and has happened on the ground. This initial visual representation of the data is invaluable for understanding how, when — and most importantly — where to allocate resources. 
Mapping confirmed cases, deaths, recoveries and active cases enables public health organizations to see where they are most needed. The popular map published by Johns Hopkins University’s Center for Systems Science and Engineering clearly illustrates the value of such visualizations. The map, which visualizes statistics on confirmed cases, fatalities and recoveries where they happened over time, has been widely shared in the media and on social networks.
The use of COVID-19 dashboards also became popular on state and local government websites seeking to inform the public. Many variations of global and locally focused dashboards are available on Esri’s COVID-19 GIS Hub.

2. Map the spread

By monitoring daily or hourly case distribution over time and location, officials can see patterns to predict future spread of the disease. They can gain even more insight by adding data layers, such as transportation networks or areas where people tend to congregate, such as shopping malls or parks.
time-enabled map produced by the University of Virginia’s Biocomplexity Institute reveals how infections spread over time and where communities may want to target interventions. On a map of the world, it shows, regionally, the number of active, confirmed, recovered cases and deaths. The map also has a slider that allows users to see how the spread of the disease has advanced in recent months.
Though much about the novel coronavirus remains unknown, using temporal and spatial data can provide quick intelligence to support preparation and decision-making.

3. Map vulnerable populations

COVID-19 disproportionately affects the elderly and those with underlying health conditions. Mapping social vulnerability, age, and other factors helps monitor at-risk groups and regions in a community. 
One of Esri’s StoryMaps published last week shows age and social vulnerability in the context of the outbreak. The story shows at-risk populations by geography alongside the Centers for Disease Control and Prevention’s Social Vulnerability Index, a collection of 15 variables that represent external stresses on health. Imagine also adding data layers to represent gathering places, such as nursing homes, homeless encampments or shelters.
By identifying the locations of higher risk groups, officials can determine where to deploy health care and emergency response resources.

4. Map capacity

Once responders have identified vulnerable populations and patterns of infection and spread, they must be ready to administer care in case of heightened demand.
Dashboard maps can visualize the locations of hospitals with available beds, clinics offering medical aid, grocery stores, pharmacies, along with data like current wait times and where hospitals can locate critical supplies like ventilators. 
Mapping resources allows states and municipalities to better understand their current capacity to respond to COVID-19 infections and to make quick adjustments to scale up where needed.
In heavily impacted cities, this kind of information could potentially save lives.

5. Communicate with maps

There are a lot of moving parts during an emergency, and it can be a challenge to organize responders, volunteers and entire communities. It can also be especially difficult to communicate efficiently among leaders, stakeholders, partners and citizens. Interactive web maps, dashboard apps and StoryMaps provide engaging information that can be absorbed and used right away.

Where to begin

By combining these five steps, leaders can create an accurate picture of a community’s risk areas and capacity to respond. Esri provides much of this essential data that communities and health organizations can use to inform their response. Check the Esri COVID-19 GIS Hub site for updates.
Tuesday, February 18, 2020

ALL YOU NEED TO KNOW ABOUT RELIEF


                              DEFINITION OF RELIEF
                Relief is a general term applied to the shape of the ground in a vertical plane. The representation of relief of the ground, above or below a datum which is normally sea level.
                On some plane maps no relief is shown, but on all topographic mapping and almost all maps required for military purpose some representation of relief is necessary,  though the extent to which it is shown and the accuracy required will vary appreciably according to the scale and purpose of the map.
ELEMENT S IN REPRESENTATION OF RELIEF
They are two distinct elements in the representation of relief.
There are;
·         Representation of height.
·         Representation of shape.
Representation of height is a factual matter in which the variations will arise from the type, density and accuracy of the information provided.
On the other hand representation of shape may be largely artistic and the methods will vary on different maps.
UNITS OF VERTICAL MEASUREMENT:
The standard unit of vertical measurement is the meter. On charts used by air forces  however the feet is still unit of height.
                The unit of height of used on a particular map is stated prominently in the margin and must be checked before use.
                Height without reference to shape is shown by fixing the height above mean sea level at selected points. These points in descending order of accuracy may be:
v  LEVELLED HEIGHTS ( BENCH MARKS)
These are the most precise height and normally appear only on scale of 1:25000 or larger. They are usually indicated by a symbol and the height expressed to one or more decimal place. A bench mark is usually a permanent mark cut on a stone built into a wall or on the side of a triangulation pillar, the height given is the height of the mark and not the level of the ground.

v  TRIGONOMETRICAL HEIGHTS
Trigonometrical  stations and survey control points similar accuracy are usually shown on maps when they are defined on the ground by a pillar or other recognizable mark.
They are usually indicated by a small triangle with the height expressed to the nearest unit.
-               1st order
-               2nd order
-             3rd  order
v  SPOT HEIGHTS
These are less accurate heights and normally without any definite mark on the ground. They are selected to indicate the height of the ground at ruling points such as tops of hills or slopes, bottoms of valleys, ridges points, and  adders, to supplement the information provided by the contour. They are shown by a dot with the height. The accuracy will vary , but should be as accurate as the contours.

v  CONTOURS:
A contour is a line on the map joining points of equal height, and is the standard method of showing relief topographic maps.
                Contouring combines accurate indication of height with a good indication of shape , especially when used in conjunction with spot height.
                Contours  are shown at regular interval ( difference in height between successive contours), which varies according to the scale of the map and to the type of country mapped. The contour interval is always stated prominently in the lower margin of the map near the graphic scale. On a 1/50,000 map with average relief the contour interval may be 10 or 20 meters ( 50 feet), at 1/250,000 scale is probably 50 meters ( 200 feet).
Contours are normally drawn as continuous lines usually in brown or similar colour. Every fourth or fifth contour depending on the vertical interval is called an Index contour and is shown by a thicker line. This helps in reading and counting the contour to determine a height , contour values are placed in break made in the contour lines.
                They are placed so that they are read way up when looking up the slope. Auxiliary contours at an intermediate vertical interval may be shown to supplement the standard contours in flat ground, when a small size within the standard vertical interval might be a significant feature.
Auxiliary contours are usually broken to distinguish them from standard contours, their values are shown.

v  FORM LINES:
Form lines are approximate contours sketched to show the general shape of the ground rather than its height. They are used when it has not been possible to obtain accurate contours. They are usually shown by broken lines, but are not given height values. They are likely to be found only in poorly mapped areas.

v  HACHURES:
Hachures  show the relief by means of short disconnected lines down the slope in the direction of water flow. The lines are short and close together on the steeper slopes, and longer and more spaced out on the greater slopes.
This is an artistic method which can give a good shape but no definite height information, it is used in many earlier maps but is now seldom used, except in cuttings, embankments and steep slopes : when used for these purpose they are usually shown in black.

v  LAYERING ( ALTITUDE TINTS):
A layer is a uniform tint applied on the map to all ground between defined limits of height above or below a datum. By using different tints for different layers or depth over an area. Layers are normally used in conjunction with contours to assist the user gaining quick appreciation of relief.

v  HILL SHADING
Hill shading is a commonly used technique to indicate shapes, either alone or in conjunction with contours and or layers. It does not itself relate any positive value of height. Basically, hill shading consists of side of a hill lighting up the sunny side to provide contrast, the darker the shading the steeper the slope on the shadow side. The light is assumed to come from the NW corner of the map.

v  BATHYMETRIC RELIEF
Bathymetric  relief , i.e. showing of depths below water of sea level when required on land maps is shown in a similar way to ground relief, viz by depth values and contours except that they are normally in blue. Their values are usually related to the mean sea level, but in inland water they may be related to the surface level  of the water, the datum should be stated on the map.


TRIANGULATION IN SURVEYING


    TRIANGULATION
Triangulation is a method used in providing controls for the connection of future surveys. It involves the use of interconnected triangles hence the name triangulation. In a triangulation scheme, all the angles of the triangle must be measured while the only distance measured is the base line.
There are various orders of the scheme, which are :
1.       Primary Triangulation
2.       Secondary Triangulation
3.       Tertiary Triangulation
4.       Minor Triangulation
ORDER OF TRIANGULATION
Order of triangulation refers to the classification of triangulation into different types. Essential principles remaining the same, triangulation is carried out with different types of instruments and methods. The different types of triangulations differ only in the accuracy stipulated for the work. Thus we have : first order or primary triangulation, second- order or secondary triangulation, and third- order or tertiary triangulation.
Ø     FIRST- ORDER TRIANGULATION
First – order triangulation is done on extensive areas, such as country, for which the highest level of accuracy is stipulated. The lengths of the sides of the triangle are large. Triangulation stations are precisely located using first- order triangulation. A stringent control is exercised in all the measurements. The instruments used must be precise and should be tested and adjusted daily.
                In primary triangulation, care is taken to minimize errors by using very high precision equipments, methods used are commensurate with the equipment, and the criteria for permissible errors are equally stringent. This is necessary because all the other surveys are based on such a triangulation.

Ø      SECOND – ORDER TRIANGULATION
Second – order triangulation is carried out within the primary triangulation stations. He extent of area covered is small and the sides of the triangle are also small. The instruments and methods used are not as précised as in first-order triangulation. The accuracy limits specified are not as stringent as in first case.

Ø     THIRD- ORDER TRIANGULATION
Third – order or tertiary triangulation is performed within the area covered by second- order triangulation stations. This triangulation gives a set of control points which are normally used by agencies conducting engineering surveys. The equipments and methods used are of lower precision. The accuracy limits are also not as stringent as in the case of the other two methods of triangulation.
                The requirements and the extent of area for the three types of triangulation are given.

Sunday, January 19, 2020

DIGITAL PHOTOGRAMMETRY

Digital Photogrammetry
      As stated earlier, digital photogrammetry is a branch of photogrammetry which has emerged as a result of advances in computer technology and sophisticated instrumentation and software capabilities. Digital photogrammetry refers to the application of image, processing techniques for map and geoinformation production using aerial photographs and satellite images. A digital photogrammetric system is an all- digital photogrammetric system which employs digital image processing techniques for solving photogrammetric problems such as map compilation, DTM collection, production of digital orthophotos, etc. It is also called pixel photogrammetry because the images are recorded in pixels. photogrammetrists are optimistic about the future of digital photogrammetry.

Digital Photogrammetric System (DPS)
    The main element of a digital photogrammetric system is the digital photogrammetric workstation (DPW). This system has achieved a great success in digital mapping and in the field of orthophoto production and in the closely-associated area of digital elevation data acquisition. A digital photogrammetric system includes a camera, a tape unit (disc unit), a computer and an array processor, and image display unit, a stereo video monitor with corresponding observation system control panel and image memory, a drawing table, raster plotter magnetic disc tape and some other peripheral devices.

           The basic characteristics of Digital Photogrammetric System are as follows:

  1.            It combine computer hardware and software that allow photogrammetric operations to be carried out on digital image data.
  2. The imaging sensor can take the form of :
  • A digital camera equipped with an areal array of charged coupled detectors (CCDs)
  • A pushbroom scanner with a linear arrary of CCDs. Each of these detectors give a direct output of the image data in a digital form through analogue-to-digital conversion (ADC) of the radiance value, which is measured electrically for each individual element of the sensor.   
  1. 3. For topographic mapping  operations, however, digital image data are most often derived from the frame images on photographic films produced by an aerial camera. these film images need to be converted to digital form by using high- precision scanners equipped with linear or areal CCD  arrarys.   In this case, the scanner forms a vital and an integral part of the DPS.
  2. Presence of a digital photogrammetric workstation on which theb required analytical ( i.e mathematically- based) photogrammetric operations are carried out to produce data for input to digital mapping system or CAD system, or GLS/LIS systems.
  3. The photogrammetric operations include: automatic or semi-automatic operations such as generation of digital elevation model data and ortho-image data.
  4. The final output may take the form of vector line map, digital terrain model data or digital ortho-images.            
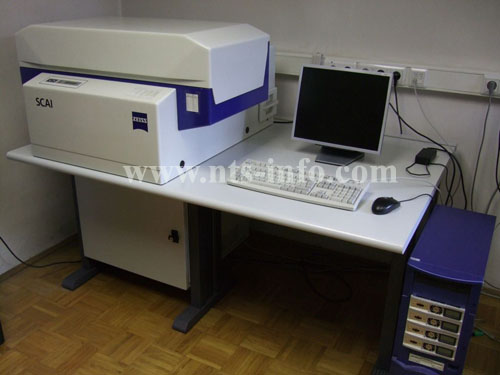
The Zeiss PHODIS ( PHOtogrammetric Digital Image-processing System) is a typical example of a digital photogrammetric instrument. it is used for digital image analysis and also for digital orthophoto production. its main components include precision photo scanners, software packages for the production of digital orthophotos, raster plotter, graphic output digital elevation models. It is characterized by its in speed acquisition, processing, analysing, interpreting, compiling, storage and plotting of data. This instrument is one of the example that show recent trends in photogrammetric instrumentation. It provides a flexible way for combining of raster and vector data into orthophoto maps.


Sunday, December 22, 2019

SURVEYING AND MONITORING OF EROSION


SURVEYING AND MONITORING OF EROSION SITE
SURVEY INVOLVEMENT IN EROSION CONTROL
Erosion has been described as the washing away of the top soil as a result of the actions of agents such as water and wind. Gully erosion, being the predominant in Southern Nigeria, is also a type of environmental degradation with a lot of disastrous consequences caused mainly by flood as a result of high precipitation, which is fallout of climate change. It can be determined, especially in terms of extent and scope, monitored and controlled.
 Soil erosion is the detachment of soil particles and it occurs by the action of water, wind and glacial ice as the case may be. Soil erosion may be gradual process that continues relatively unnoticed, or it may occur at an alarming rate causing serious loss of top soil, which in some cases advance further into gullies of unimaginable magnitude and consequence.
Generally erosion occurs when raindrops, rainy seasons’ runoff, or floodwaters wear away and transport soil particles. It is a complex natural process that has often been accelerated by human activities such as land clearance, agriculture, construction, surface mining, and urbanization.
Types of Erosion:
 There are many types of erosion and mentioned here are a few of them, which include: Sheet erosion, Rill erosion, Valley or stream erosion and Gully erosion. Gully erosion, being the main topic of the discus, results where water flows along a linear depression eroding a trench or gully.. It is particularly noticeable in the formation of hollow ways where prior to being tracked, an old rural road has over many years become significantly lower than the surrounding fields.  It usually begins gradually, being initially insignificant, and graduates into an unimaginable monstrous dimension of momentous consequences when ignored. In its developmental stage, it might be in form of a shallow depression following the line of a footpath, but would sooner grow and expand in both depth and bounds into a gruesome gully.
Causes of gully erosion:
 The likely causative factors of gully erosion could be either natural or anthropogenic sources  Natural factors include:
 1. Nature of soil. Some soils have high erodibilty factors hence susceptible to high rate of erosion while some soils have very low erodibilty factors and as such low rate of erosion.
 2. Topography of terrain. Rugged and steep terrains with high slope are more likely to experience high gully erosion rate than flat terrain. This is so because flood, which is an agent of soil erosion increases in velocity with high slope than on flat terrain thereby acquiring greater momentum to move displaced soil particles from one place to another.
 3. Amount of precipitation results in high volume of rainfall, which is one of the major factors of gully erosion. The higher the amount of rainfall, the higher the quantity of soil particles that are dissolved, displaced and moved away. High precipitation amounts to high level of flood in most areas. Some areas experience higher precipitation than others.
4. Land cover. Availability of tree canopies and some plants naturally break the effects of direct raindrops on the soil on the one hand and reduce the velocity of flood and its consequences on the soil on the other.
 Areas without these natural protections, experience high level of erosion and subsequent gullies.
 Anthropogenic factors include:
1. Construction projects. Actions carried out both during and after construction such as grading, clearing, and other activities that disturb the surface of the soil, alter existing topography, and remove existing vegetation, can increase erosion potential during construction.
 2. Urbanization involving road construction, building development, etc., contribute immensely to gully sites development.
 3. Sand excavation. Sand excavation along the sides of the roads by individuals who obtain permission to carry out such excavation contribute to gully developments within the region of study.
 4. Quarrying and mining activities. Abandoned pits as a result of mining activities over a long period of time develop into gullies.
 5. Increase in the areas covered by pavements and structures and a failure to incorporate into the construction design, control measures that adequately stabilize slopes, re-establish cover on exposed soils, or convey runoffs, can increase erosion long after construction is completed.
 6. Poor construction e.g. of roads without adequate provision of drainage to rightly direct the runoffs.
 7. Some other causative factors are cattle grazing, deforestation, and bad farming habits of the people and so on.
Effects of erosion:
 The overbearing effects of erosion on the environment of the host areas cannot be emphasized. Apart from being a major source of land degradation, it has been categorized as one of the major causes of environmental disaster in the state and its environs. One of these effects includes the formation of gullies. As the erosion continues to remove soil along drainage lines, the affected areas continue to deepen. The end results over a long period of years are deep gullies, which continue to enlarge if no measure is taken to check it. The monstrous nature of gullies are such that they continue to enlarge and deepen that some have gone as deep as over 100m and these have resulted in the following.
i.                  Displacement of communities/settlements.
ii.                Destruction of Natural Habitat. Gullies are so devastating that they destroy the natural habitat thereby affecting the flora and fauna in the area.
iii.              Destruction of houses. Cracking of houses and falling of buildings into gully sites are common features in the area. People have lost their investments to gully expansion in areas like Agulu, Nanka, Nnewi, etc., including the study erosion site at Omagba II Onitsha.
iv.              Sedimentation. One of the consequences of gully erosion is the resultant sedimentation. This is because as the soil is being eroded from one area caused by water runoff, it is being deposited in other areas as sediments This has resulted in the disappearance of some streams and rivers within the zone.
v.                 Land Degradation: this is one of the worst environmental problems facing many people worldwide. Over 40million are affected in Nigeria (Uchegbu, 2002). It is the general and gradual reduction of land value mainly as a result of some unhealthy anthropogenic activities on the land. When top soils are washed away by erosion, the soil looses values due to the washing away of soil nutrients by water. Also gullies on their own part create trenches and deep holes that suddenly cut off large portions of lands thereby degrading the values of such lands.
vi.              Damage to Infrastructure. Some infrastructures such as roads and concrete drainages have been broken down and some communities completely cut off.
    The role of surveying and mapping in the management and control of gully erosion.
The surveys carried out for gully control and remediation included: 
• Mapping of catchment basin and location of rills and secondary gullies contributing run off to the main gully.
 • Detailed surveys of existing control infrastructure including gutters, culverts, catch pits, drainage channels e.t.c
• Longitudinal bed profile from head to outlet of the main gully.
 • Planimetric survey of the gully head at large scale.
 • Cross sectional surveys of the gully to determine the nature of the stage of gully development i.e whether V or U shaped.

REMOTE SENSING AND WAVE LENGTH


REMOTE SENSING
Remote sensing is a process of obtaining information about an object, area, or phenomenon through the analysis of data by a device without being in contact with the object, area or phenomenon being studied. It is a methodology employed to study from a distance the physical and chemical characteristics of objects. Human sight, smell, and hearing are examples of rudimentary forms of remote sensing. Photographic interpretation is considered a form of remote sensing, however, it is generally limited to a study of images recorded on photographic emulsions sensitive to energy in or near the visible portion of the electromagnetic spectrum. Remote sensing discuss in this chapter treats sensor system which record energy in more quantifiable formats over a much broader range of the electromagnetic spectrum. Most of the remote sensing methods make use of the reflected infrared band, thermal infrared band, and microwave portions of the electromagnetic spectrum.
NECESSITY AND IMPORTANCE
With growing population and rising standard of living, pressure on natural resources has been increasing day by day. It, therefore, becomes necessary to manage the available resources effectively and economically, it requires periodic preparation of accurate inventories of natural resources both renewable and non-renewable. This can be achieved through remote sensing very efficiently since it provides multispectral-multitemporal data useful for resources inventory, monitoring and their management.
APPLICATIONS AND SCOPE
Remote sensing is being used to collect the information about agriculture, forestry, geograph, archeology, weather and climate, marine environment, hydrology, water resources management and assessment, engineering, etc. It has vast applications in exploration of natural resources, analysis of land use and land cover, information about environments, natural hazard studies such as earthquakes, land slide, land subsidence, flood, etc.
ELECTROMAGNETIC ENERGY AND ELECTROMAGNETIC SPECTRUM
Electromagnetic energy is a form of energy which moves with velocity of light in a harmonic pattern consisting of sinusoidal waves of varying wavelength. Remote sensing makes use of electromagnetic radiation which is not visible to human eyes.
            Electromagnetic energy is detected only when it interacts with matter. For example, light is seen in dark only when electromagnetic radiation interacts with dust and other particles present in air.
            The change in electromagnetic energy takes place when it interacts with the earth’s surface and environment. Remote sensing detects these changes and the data obtained is used for determination of the characteristics of the earth’s surface.
Electromagnetic waves can be described In terms of three basic parameters:
1.      Velocity (c)
2.      Wavelengths (λ)
3.      Frequency (ϝ)
The following relationship exists between the above three parameters:
                        Λϝ = c i.e., = 3.8 * 108 m/sec.
Where  λ is in meters  and ϝ is in hertz.
Electromagnetic spectrum ranges from most energetic rays at wavelength less than 10-13m to very long waves at wavelength longer than 100km. various components of an electromagnetic spectrum with their wavelengths are given below:
            1.  y and X rays                               Up to 10-8m wavelength region.
            2. Ultraviolet                                  from 10-9 to 10-7m.
            3. Visible region                             (0.4 – 0.7) Um is only one of many forms                           
                                                            electromagnetic energy and mostly used to acquire remotely sensed data for natural resources mapping. This wavelength interval is generally referred to a LIGHT.
            4. Near-, Middle-, Thermal                from 0.7 to 20Um: Near Infrared- (0.7- 1.3) um,
                        Far – Infrared.                          Middle Infrared- (1.3 – 3.0), Thermal Infrared- (3.0 –
                                                                              14.0) um, and Far Infrared- (7.0 – 15.0) um.
            5. Microwave region                            Down to a wavelength of 1m.
            6. Radio waves.                                     Wavelengths longer than 1m.
There are certain regions of electromagnetic spectrum which can penetrate through the atmosphere without any significant loss of radiations. Such regions are called atmospheric windows.
            Electromagnetic radiations are affected by atmospheric effects known as scattering and absorption.


Wednesday, December 18, 2019

ADJUSTMENT OF MEASUREMENTS


ADJUSTMENT OF SURVEY MEASUREMENTS
Although measurement of a quantity is a single act, a typical survey measurement may involve several elementary operations, such as centering, pointing, setting and reading. In performing these operations and due to human limitations, imperfection in instrument, environment changes or carelessness on the part of the observer, certain amount of errors is bound to creep into the measurements. Hence, the measurement always contains errors. Since the measured quantities are used to calculate other quantities such as area, volume, elevation, slope, through relationships with the measured quantities, the errors in measured quantities get propagated into the calculated quantities.
The errors in the measured quantities should be eliminated or minimized before they are used for computing other quantities.
After removing the blunders and systematic errors, the errors which remain in the measurements are residual, random or accidental errors. These errors are minimized or adjusted, and the adjusted quantity is known as the most probable value of a measured quantity. It is the most probable value of a measured quantity which is used for computing other quantities.
The following definitions of some of the terms should be clearly understood in adjustment of the measurements:
          TRUE VALUE:  The value of a quantity which is free from all errors is called the true value of quantity. Because it is not possible to eliminate all the errors completely from a measured quantity, the true value cannot be determined.
          OBSERVATION:  The measured numerical value of a quantity is known as observation. No measurement is made until something is observed. Accordingly, the terms measurement and observation are often used synonymously.
          The observations may be classified as:
·       Direct observations
·       Indirect observations
Direct observation: If the value of a quantity is measured directly, for example, measurement of an angle, the observation is said to be direct observation.
Indirect observation: An observation is said to be indirect if the value of the quantity is deduced from the measurements of other quantities. For example, the value of the angle at the main triangulation station computed from the measured angles at the satellite station.

Observed value of a quantity: Observed value of a quantity is the value obtained from the observation after eliminating the mistake and systematic errors. The observed values contain random or residual errors.
     The observed value of a quantity may be classified as:
·       Independent quantity.
·       Conditioned quantity.
Independent quantity:  If the value of an observed quantity is independent of the value of other quantities, it is said to be an independent quantity. For example, the reduced level of a point.
Conditioned quantity: If the value of an observed quantity is dependent upon the value of other quantities it is called a conditioned quantity. For example, the three angles A, B and C in a plane triangle are conditioned quantities since they are related by the condition equation A + B + C = 1800.
Most probable value:  The most probable value of a quantity is the value which has more chances of being true than any other value.
True error: The difference between the true value and the observed value is known as true error. Thus
True error = Observed value – True value.
Most probable error:  It may be defined as the quantity which is subtracted from or added to the most probable value of a quantity. It fixes the bounded limits within which, the true value of the observed quantity may lie.
Residual error: The difference between the observed quantities and its most probable value is called residual error, residual error or variation. Thus,
Residual error or residual = Observed value – Most probable value.
Observation equation: The relation between the observed quantities is known as an observation equation. For example, α + β = 870 40’ 38”.
Condition equation: A condition equation is the equation expressing the relation existing between the several dependent quantities. For example, at a station if four angles ϴ1, ϴ2, ϴ3 and ϴ4 have been observed then ϴ1 + ϴ2 + ϴ3 + ϴ4 = 3600.
In a braced quadrilateral the sum of all the eight observed angles is 3600. Thus,
ϴ1 + ϴ2 + ϴ3 + ϴ4 + ϴ5 + ϴ6 + ϴ7 + ϴ8 = 3600
Normal equation: A normal equation is the one which is formed by multiplying each equation by the coefficient of the unknown whose normal equation is to be found and by adding the equations thus formed. The number of normal equation is the same as the number of unknowns. The most probable values of the unknowns are found out by using by the normal equations.


Monday, September 2, 2019

ERRORS AND REDUCTION IN COMPASS SURVEY

SOURCES OF ERRORS IN COMPASS SURVEY:
Errors in compass surveying arise from both angular and linear measurements. Here we are only considering angular errors. The following are some of the sources of angular errors in compass surveying:

  • Instrumental Error:
         Instrumental errors are errors inherent in the instrument itself. They arise chiefly from improper graduation of the compass ring, wrong material of the pivot, excessive weight of the needle etc. In practice, no correction is applied to counter this error, but they are minimized by reading both the forward and back bearings of a line.
  • Observational Error:
         The best of the prismatic compasses are graduated to read to the nearest half of a degree. More precisional  measurement can be made with them only by estimation. Great care should be exercised in estimating readings as they can lead to observational errors. Observational errors can also arise due to poor alignment of the two value ( i.e. forward bearing and back bearings) during observation. Small observational errors are not normally corrected for, but gross observational errors render the observed quantity unreliable and therefore the same must be rejected.
  • Local Attraction Errors:
          Local attraction error is the main source of error in compass surveying. Local attraction errors are due to magnetic objects in the environment of the observation; which tend to pull the magnetic needle away from its correct position. They are manifested by significant differences between the forward and backward readings of a line. The errors caused by local attraction are normally corrected for in compass surveying. 
  • Magnetic Variations:
          Magnetic variation affects the values given by compasses. However, no attempt is made to correct for this type of error. The date of observation is important in this regards, as some of these variations depends on time.
  • Parallax Effects:
         In relation to compass surveying, parallax effect is the apparent motion of a target in relation to the sighting wire at the time of observation. Care should be taken to avoid this effect as it can lead to errors in the field.
REDUCTION

To reduce the observations, the columns of differences and errors are worked out and studied in order to determine if error due to local attractions are present. this is possible since some errors in the observation may be due to imperfections on the part of the surveyor. Errors due to imperfections are not adjusted but the mean directions indicated by the forward and back bearings are used. However, if errors due to local attraction are present, the following procedure is used in adjusting the errors. Consider the observation given below:

  LINE     LENGTH    FORWARD     BACK    DIFF    ERROR     CORRECTED     CORRECTED  
                                      BEARING      BRG.                                       FORWARD        BACK BRG. 
    AB        125               086                  266        180        0                      086                     266
    BC         50                 170                  352        182        2                      170                     350
    CD         50                 197                  015         182       2                      195                     015
    DE         100               270                   090         180       0                      270                     090
    EA         80                  345                   165         180       0                     345                     165
     In which it is suspected that local attraction errors are present. To start with, a line in which the two bearings differ by exactly 180∘ is selected, and it is assumed that there is no local attraction anywhere on this line. Thus, bearings taken at either end of this line are accepted as recorded. Now, consider the above example, from the table, we noted that lines BC and CD have errors of 2∘ each. Suppose we start the adjustment from line EA, we observe that station E and A are also free from local attraction, so is station B.
      On line BC, an error of 2∘ is obtained which most probably comes from some local attraction at station C an line CD, the same error of 2∘ at station C manifests itself. thus, the corrected forward and back bearings are as given in the table above. It should be noted that this adjustment does not ensure the internal geometry of the figure observed. That is to  say, the figure ABCDEA may not have internal angle equal to (2n - 4)90 or external angles equal to (2n + 4)90.
NOTE:

  • The same correction should be applied to all bearings observed from one station.
  • After adjustment, the forward and back bearing of a line should differ by exactly 180∘
  • If in all the observations, no two bearing of a line differ by exactly 180, the correction should be made starting from a line whose bearing have the least discrepancy between the back and forward bearing readings. 
  • The said corrections refer to local attraction errors and not to observation errors arising from imperfections of the observer and instrument. If gross error of observation occur, the surveyor must go back to the field, to obtain a true sample of the quantity measured. If small errors occur due to imperfections, mean observed directions must be used.

Sunday, September 1, 2019

SOURCES OF ERRORS IN LINEAR MEASUREMENT AND CORRECTIONS There are various sources of errors in making direct linear measurement and those errors must be examined for their cause and effect so that precaution may be taken to guard against unacceptable errors. However , errors are of three kinds. 1. SYSTEMATIC OR CUMULATIVE ERRORS: These errors exist in any survey measurement and each additional measurement increases the effect of the errors such errors which maybe either positive or negative can be an appreciable effect but the effect can be reduced by taking enough precautionary measures or by the application of corrections to the observed measurement. • The six sources of this type of error are as follow: 1. Wrong length of tape 2. Poor ranging 3. Poor straightening/ alignment 4. Slope 5. Sag 6. Temperature 2. COMPENSATION OR ACCIDENTAL ERRORS: Although every precaution maybe taken, certain unavoidable errors always exist in any measurement. Such errors are generally of less importance than systematic errors. As they are sometimes positive and sometimes negative they tend to cancel out in the long run. • There are two sources of this types of errors: i. Holding and marking ii. Variation in tension 3. GROSS ERRORS: These are errors that arise as a result of mistakes, carelessness or lack of experience. They are quite random and allowance cannot be made for them. • The four source of mistake are: i. Displacement of arrows ii. Displacement of station marks iii. Miscounting tape length iv. Misreading the tape • CORRECTIONS TO DISTANCE MEASUREMENT: Different method and formula are adopted in the correction of error in distance measurement according to the source of such error, they are as follows: 1. EFFECT OF WRONG LENGTH OF TAPE This is the most serious of errors, particularly with a chain because of its tendency to stretch. Chain and fiber tapes should be tasted frequently, steel bands need testing less frequently but should always be tested for precise work or after ant repairs. However, measurement made with a tape found to be in error can be corrected using the formula: True Distance = Actual Length of Tape Measurement Distance Nominal Length of Tape Where Area calculations made from measurement which are in error they can be corrected using the formula: True Area = Actual Length of Tape Measured Area Nominal Length of Tape 2. POOR RANGING: This gives rise to a relatively small error, if a whole tape length deviated a distance from the ranged straight line the error in length is d2/2L Where L is the length of tape and d is distance measured. 3. POOR ALIGNMENT: The effect is similar to that of poor ranging but if both ends of the tape are on the correction line and the center is off by a distance, the effect is greater being 2d2/1 or twice the errors arising in each half of the tape . 4. SLOPE; Although the effect of slope is similar to that of poor ranging but the vertical plane it can be the source of large errors. The correction is given by L(1-cos 0). Where 0 is the angle of slope and L is the length of the line. For difference in height between two points, the slope correction is given as. Δh2 2L Where L = Distance between the two points. 5. SAG: When a tape is suspended as in step chaining or when measuring over rough ground the unsupported part will sag given an observed reading which will be great the amount of error caused by sag is proportional to W2L3cos20 24T2 Where: w = weight of the tape per meter length in Newtons or kilogramme force. T = tension applied to the tape in the same unit weight. L = Length of tape between supports 0 = The angle of slope between tape supports. And it increases at the cube of the suspended length. 6. TEMPERATURE VARIATION: The effect of temperature variation is negative in work where a chain is used. For precise measurement a steel band temperature correction must be made. Therefore the error = L×C×T Where L = measured length C = Coefficient of expansion T = temperature difference from standard 7. VARIATION IN TENSION: The tension applied to a tape should be the same as that applied when testing it against a standard variation. Tension are bound to occur even when using a spring balance, but the resulting errors are small and tend to compensate each other, if the tape is consistently pulled too hard or too lightly a cumulative error will arise and this should be guided against particularly when using lines or plastic tapes. The formula is given as: Correction = L ( TF - TS ) AE Where TF = Tension applied to tape(N) TS = Standard Tension (N) L = Tape length under tension in meters. A = Cross-sectional area of the tape (mm2) E = Young modulus of elasticity for the tape material (Nmm2) ( for steel tape is 200,000N mm-2 or 200 KN/mm-2).

THREE EASY STEPS FOR THEODOLITE TEMPORARY ADJUSTMENT

THREE EASY STEPS FOR THEODOLITE TEMPORARY ADJUSTMENT Temporary adjustments: These are those adjustments carried out at every set-up of the instrument before observations are made. The following actions constitute the temporary adjustment: 1. Setting up the instrument over the ground mark. 2. Levelling up the instrument. 3. Clearing of parallax and focusing. 1. SETTING OVER THE GROUND MARK. a. Spread out the tripod legs and mount the theodolite b. Spread the tripod legs over the ground mark, make sure the plumb bob is approximately over the ground mark. c. Continue to adjust the tripod legs and at the same time watch the circular bubble until the instrument is fully set over the ground mark. d. If the instrument has an in- built optical plummet it should be used at this point to check the accuracy of setting over the ground mark. 2. LEVELLING THE INSTRUMENT. Levelling of the instrument is carried out as follows: a. Place the longitudinal axis of the bubble tube parallel to any two of the foot screws. Using the two foot screws bring the bubble to the centre of its run. Note: The bubble runs to the high side of the instrument. b. Turn the instrument through 900 and again bring the bubble to the centre of its run using the remaining foot screw. c. Rotate the instrument through 1800 and observe the position of the bubble . if it remains at the center of its run, it is then properly levelled. 3. CLEARING OF PARALLAX AND FOCUSING. a. To focus and clear parallax, point the telescope at a light background example the sky. b. Focus the cross hires using the eye piece until they form clear, sharp image. c. Point the telescope at the first station to be observed, focus and check for parallax by moving the eye across the eye piece. The instrument is now ready for observation of the station occupied.

GET OBSERVED ANGLE AND BEARING USING TAPE MEASUREMENTS

The fundamental principal of the science and art of surveying are based on very simple geometrical concept. This concept generally stated that if two points in the field are selected and established (coordinated) and the distance between them measured (base line). These can be represented on paper by two points placed in a convenient position on the sheet and at a distance apart depending upon the scale to which it is proposed to plot the survey. Fig 1. A B 542855.214mE 542853.701mE 122293.904mN 122273.564mN From these initial points other points can be located by two suitable measurement in the field and plotted in their relative position, that’s the “ whole to part principle”. Let us examine possible methods of locating a point say point C with respect to the two given points A and B . Distance AC and AB are measured respectively. Point C is plotted on the base map by using a pair of compasses, as the intersection point of arcs with centers A and B and radii scaling the measured distances. In this way, the three sides of the triangle are known and in turn all the elements of the triangle can be measured, derived or computed. This system is employed in chain surveying method and trilateration. Also the triangulation method of surveying is based on this principle. Having four (4) points ABCD with points A and B coordinated and as a base line, with their distances B to C , C to D and D to A all known , as gotten with a tape. We can compute and derive the observed angle (OA) which in turn gives us the bearing from B to C, C to D and from D to A respectively. We compute and derive the observed angle (OA) by simple getting the distance of any of the diagonal, either from A to C or B to A, in turn we have a triangle with the distance or length of each sides known. A B Using the coordinates of A and B we derive its bearing and distance which is gotten using this simple formula: EB - EA = ΔE NB - NA = ΔN Where : EB = Easting of point B EA= Easting of point A NB = Northing of point B NA = Northing of point A Bearing AB = Tan-1 ΔE ΔN Distance L = √∆E^2+∆N^2 Now to compute for observed angle (OA) we figure out a triangle says ABD : where all the sides are known . Using the cosine formula : a2 = b2 + c2 – 2bcCosA Or CosA = b2 + c2 – a2 2bc We compute and derive angle A. using the same formula we compute for angle B , having computed for two angles we can now use the sine rule , to compute for the remaining angle. Sine formula : a = b sinA sinB or we simply use the triangle rule of sum of angles in a triangle is equals 1800 we also do the same for triangle BCD and compute and derive its angles (OA). We now make use of those angles and the first initial bearing derived using the coordinate to compute for the bearing of the other sides, using this simple formula; BB + OA = FB Where BB = back bearing which is ±180° for the initial bearing OA = observed angle ( computed angle) FB = foreward bearing .